Industries such as engineering, infrastructure, telecommunications, agriculture, and disaster recovery use geospatial data to make informed decisions. The primary challenge for these industries is determining where to find the data and tools they need. A geospatial data marketplace solves this challenge by providing one place to access a variety of satellite imagery datasets for nearly every location on Earth from multiple commercial providers.
The marketplace gives the user the needed tools to quickly search an area of interest (AOI) on a world map. Users can then compare results by date, price, resolution, and other criteria. Once the needed data is located, the process allows for easy purchase of, and access to, all of the datasets the user has requested.
My responsibilities were to oversee and execute the UX/UI design for the marketplace beta as well as develop concepts for image and data analytics.
Role
UX/UI Design Lead
Deliverables
Flow Diagrams, Wireframes, Maps, and UI
Client
Harris Geospatial

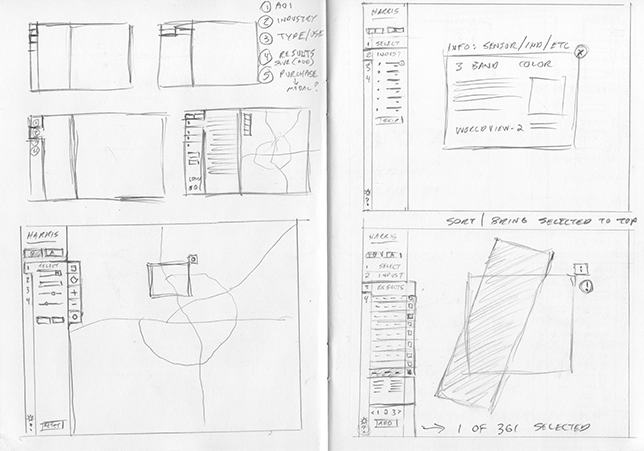
Thumbnail Concepts
Sketching was used throughout the design process and allowed for exploring many ideas and concepts very quickly, while also being used for rough wireframes and basic interaction design. In addition, core aspects of the responsive behavior were designed laying the groundwork for the approach to the overall interface.

Primary User Workflow
User workflows and service diagrams were developed for several aspects of the project. A primary user workflow diagram was used as the main reference for all involved in the development of the marketplace.

Wireframes
Desktop and mobile wireframes were used as they traditionally are for functionality, structure, and content. However, for this project, they were also used as an educational tool to initiate company executives and management to how UX design benefits the company.


Map Base Layer
The foundation of the marketplace toolset is the map base layer. It is designed to clearly display detailed geographic information while having adequate contrast against images, layers, and data that will be overlaid on top. Typography is designed for readability at various map zoom levels. The width is semi-condensed to allow for longer text lengths on mobile devices while tying into the client’s corporate branding.
View the fully functional map base layer below.
Searching the Catalog
Users of all skill levels will use the marketplace as a resource. To accommodate this varied user base, basic and advanced search tools are made available.
Basic tools for all users:
- Address/Location field to provide a starting point on the world map
- Map pan and zoom that allows for positioning the map without an address/location search
- Drawing tools to create a polygon for indicating an area of interest (AOI)
- Start and End Date fields to establish a desired date range for the imagery
- Image Resolution slider for smaller areas with high resolution and larger areas with low resolution
- Tooltips for information and guidance
Advanced tools for Geographic Information System (GIS) professionals:
- Upload AOI data function in coordinates or GeoJSON format
- Minimum AOI coverage slider to ensure a certain percentage of a given image collection falls within the AOI
- Cloud Cover slider to prevent the indicated AOI from being obscured by clouds
- Image Off Nadir slider for maximum view angle from directly overhead
- Sun Elevation slider for angle of the sun above the horizon


Viewing Results
Once a search has been completed, results are displayed by date (newest to oldest) by default. Along with the date, resolution and price are displayed as primary information on the result cards. Secondary information is displayed as three icons representing AOI coverage, cloud cover, and delivery time. These icons are color-coded red, yellow, and green, and change depending on whether or not they fall in an acceptable range for use. This function allows for the user to quickly scan the results to find the image, or images, that best meets their needs. In addition, the user can sort and filter results by several data types and criteria. They can also cycle through previews of images they have selected from the results before adding them to their shopping cart.

Checkout and Purchase
Once an image or set of images are added to the user’s shopping cart, the user can review additional details on a given image, change file format options, and download various data files tied to the AOI. The check out process is kept simple with a clear indication as to where the user is in the purchase process. The user’s cart is always accessible and all orders are available via the user dashboard.


The Future: Services & Analytics
Beyond offering image data, in the future, the marketplace will offer services and analytics. Services will consist of imagery subscriptions over a geographic area for specific intervals of time. Analytics will allow for change detection, vegetative analysis, vessel tracking, and detection of surface characteristics. These will be available to industries such as public safety, utilities, maritime, and agriculture.
The first example below shows an AOI requesting change detection analytics of structures within approach and departure patterns for Dubai International Airport. The second example shows the detected changes. Areas marked in blue indicate new structures. Areas in red indicate structures that have been removed.

